Financial Information
Management Indices(Cash flows)
(unit : million yen)
| 2021/10 |
2022/10 |
2023/10 |
2024/10 |
2025/10 |
|
|---|---|---|---|---|---|
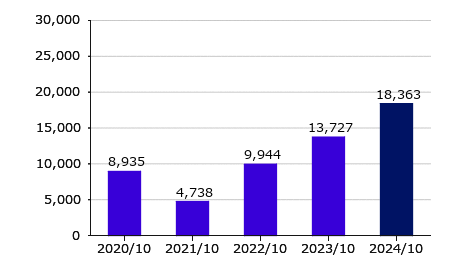
| Cash flows from operating activities | 4,738 | 9,944 | 13,727 | 18,363 | 14,869 |
| Cash flows from investing activities | -9,477 | -12,105 | -14,544 | -10,346 | -18,550 |
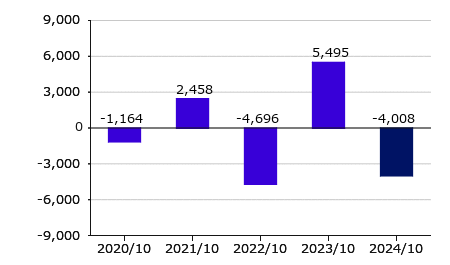
| Cash flows from financing activities | 2,458 | -4,696 | 5,495 | -4,008 | 4,946 |
| Free Cash flows | -4,739 | -2,161 | -817 | 8,017 | -3,681 |
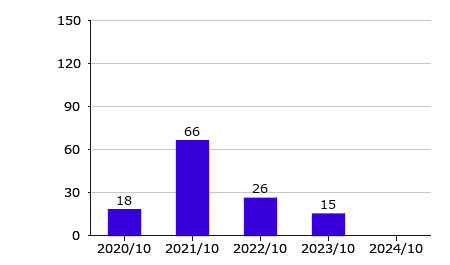
| R & D expenses | 66 | 26 | 15 | ||
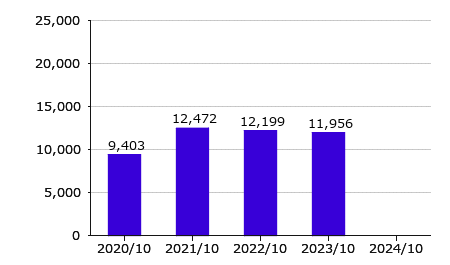
| Capital investment | 12,472 | 12,199 | 11,956 | ||
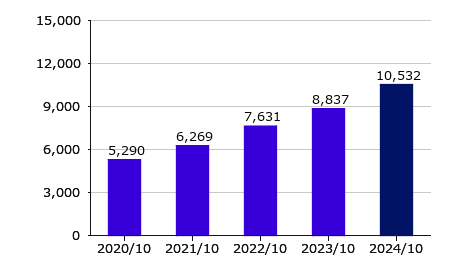
| Depreciation | 6,269 | 7,631 | 8,837 | 10,532 | 10,688 |
